SentVi vs. I2
Award-winning, small, minority-owned business with over 30 years of experience delivering state-of-the-art solutions to a wide range of customers.

How Does SentVi Compare to i2 Analysts Notebook?
Whether you’re in the intelligence, defense, counter-terrorism, drug interdiction, law enforcement, research, or other data-intensive environments, SentVi will amaze you with its next-generation data analysis and visualization features. In fact, it is so impressive that In-Q-Tel, the CIA’s venture capital arm, is an investor in FMS and a strong supporter of our efforts to bring leading-edge technology into their mission.
i2 Analyst’s Notebook from Harris (formerly IBM) has dominated the data analyst market for years. While the technology was leading edge when it was introduced in the early 1990’s, it has fallen behind technologically and fails to meet the demanding needs of today’s analyst.
To clear any confusion, this page summarizes the significant advantages of Sentinel Visualizer over Analyst’s Notebook. Discover why so many organizations choose Sentvi as an alternative to Analyst’s Notebook for their most demanding needs.
Key Differences:

Committed to Supporting the Analyst

Modern User Interface
Developed with Microsoft Visual Studio .NET, SentVi uses leading-edge technology with a modern, intuitive user interface. The user interface is very intuitive with right mouse click support, detachable panels, and multi-monitor support. Multiple ways to display and analyze data are all built in and easy to apply, minimizing the need for extensive training to get up and running.

No Dongle
Open Data Format
SentVi stores data in Microsoft SQL Server format using SQL Express on your desktop or a network shared SQL Server database. We publish our schema and provide data import and export utilities.
Analyst’s Notebook locks you into a proprietary data format and prevents you from exporting it. With SentVi and SQL Server, you’ll always be able to grow with your data and extend it for other missions.
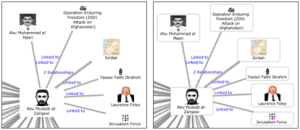
Add Unique Pictures for Each Entity
Each entity in SentVi can have its own picture that is displayed directly on your link chart to let you better understand your data. Entities in Analyst’s Notebook are shown with a built-in graphic by type (e.g. stick people).
Data Driven, Highly Scalable, and Automated
Analyst’s Notebook lets you draw charts, but it’s all manual and not analytical. It may work if you already know what you want to draw, but it’s not appropriate when you’re trying to learn from your data. Making modifications when new data is added is a cumbersome and tedious process. Filtering data is also a manual chore.
SentVi helps you discover new ideas from your data, not simply display what you already know. SentVi starts from the data and lets its analytic tools show you the results. Advanced redrawing and layout algorithms make it easy to adjust your network when new data is added or existing data is filtered.
Other Key Differences:
♦ Advanced Data Analysis: All Links Are Not Equal
♦ Advanced Link Analysis: Shortest Path, All Paths, Common Links
♦ Social Network Analysis (SNA)
♦ Temporal Analysis
♦ Integrated Geospatial Mapping
Pricing:
- SentVi (single-computer perpetual license) starting at: $3,000
- i2 (base version): $7,160
