Link Analysis Overview
Interconnected data is difficult to understand with traditional tools showing rows and columns. SentVi provides advanced visualization to help you find meaning from complex, interconnected relationships.
Create Large Link Charts
With Microsoft SQL Server, SentVi supports millions of entity and relationship records. Send all your data to the diagram or use search features like the Dataset Builder and Advanced Dataset Builder to select a subset of data for your link chart. Pick entities and relationships by their specific characteristics and links to each other. You can start big and drill down to details, or expand from individual entities one degree at a time until you include their entire network. Thousands of data points can be added to your diagram in a highly optimized, scalable, and shareable manner.

Contact Tracing Network

Multiple Disconnected Networks, Side-by-Side

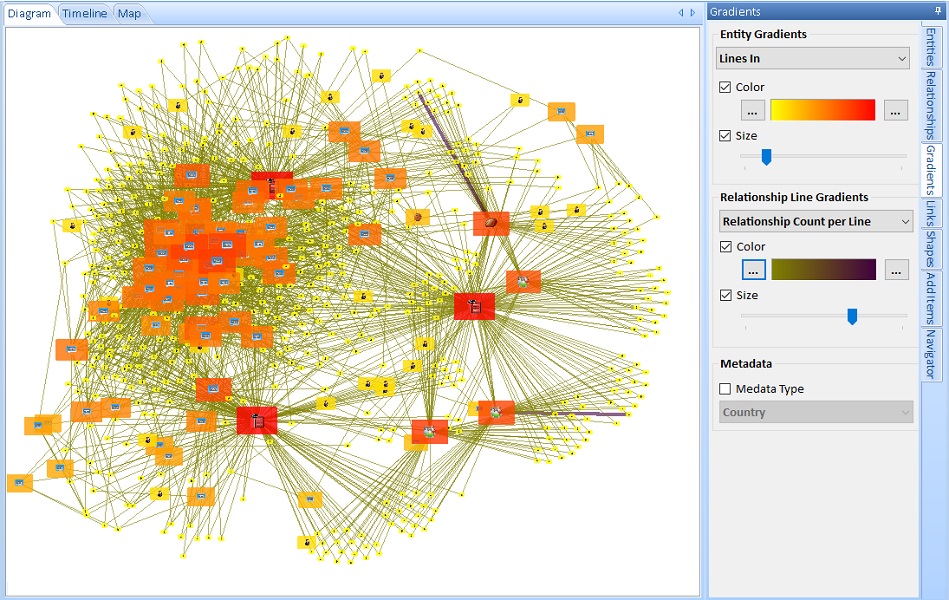
Thousands of Connected Phones

Multiple Circle Layout

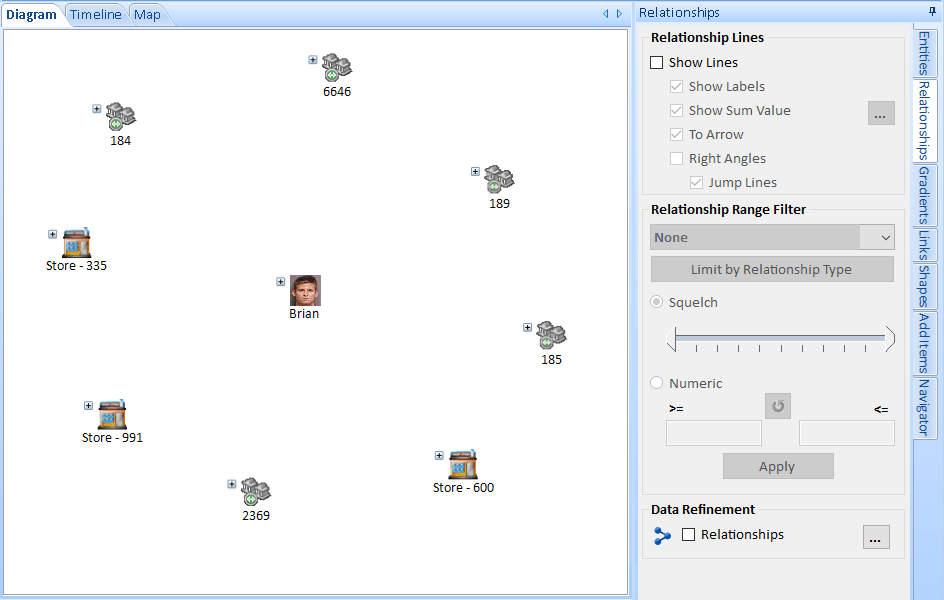
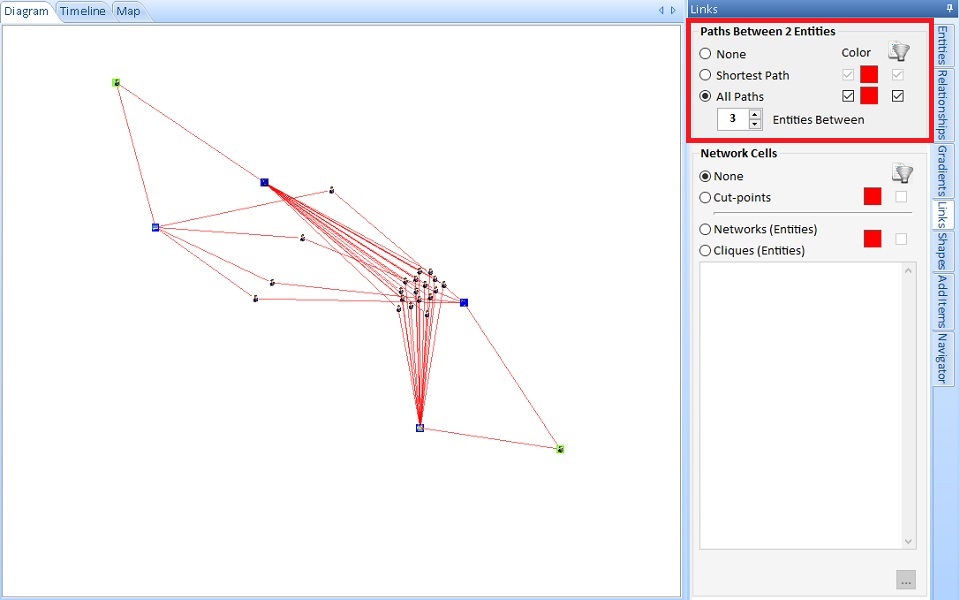
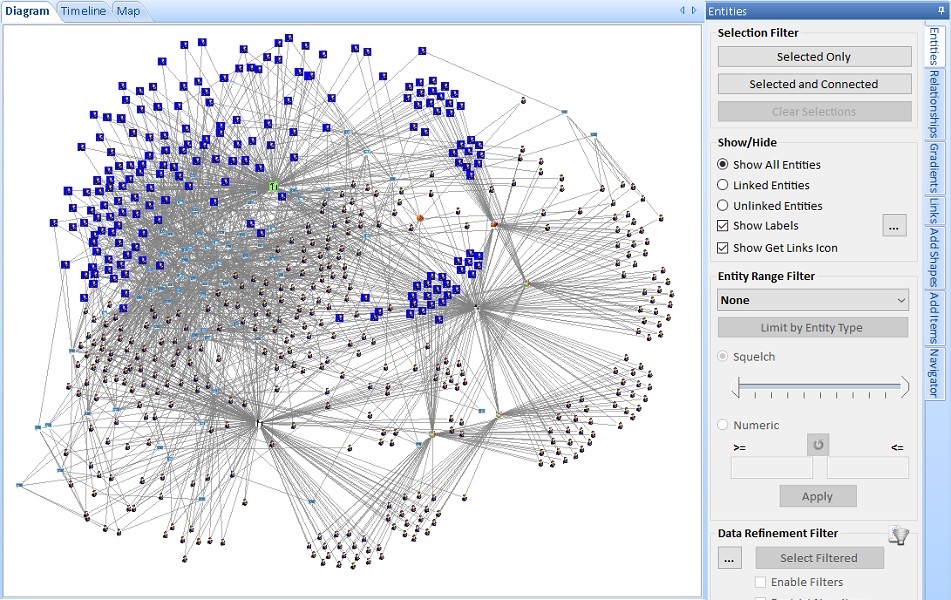
Link Chart Display and Analysis Tools

Save, Share and Merge Diagrams
You can save your diagrams into the database to retrieve them in the future. They can be shared with other authorized users or kept private to yourself. You can also merge saved diagrams into your current diagram to combine multiple sets of analysis.