Layout Options
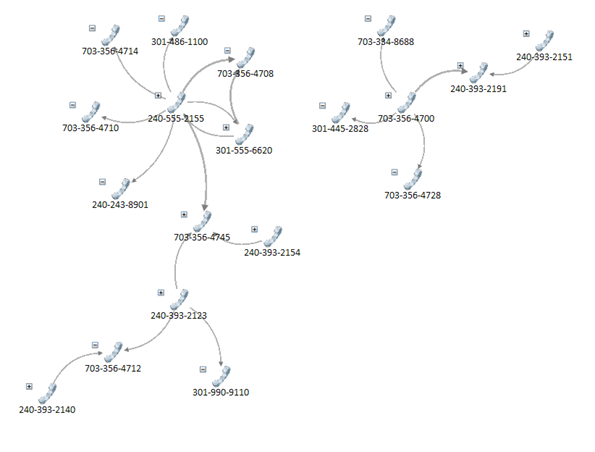
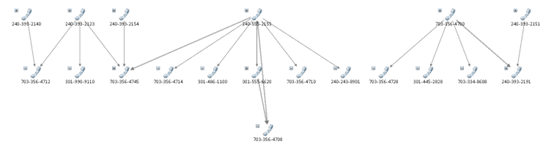
Once you add entities to your Visualizer Diagram, the Layout button offers a wide range of options to arrange your network entities including: incremental, circular, elliptical, rectangular, square, triangular, orthogonal, force directed, and hierarchical.
Quick selection by question
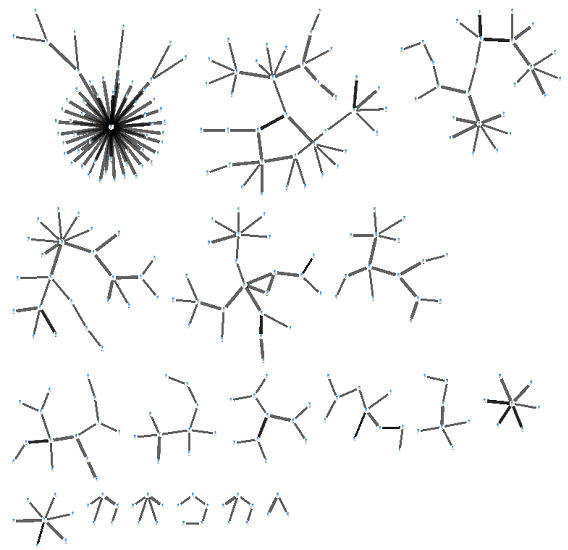
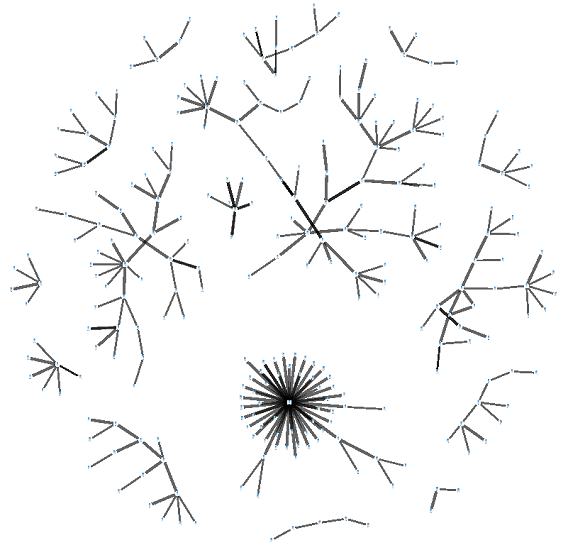
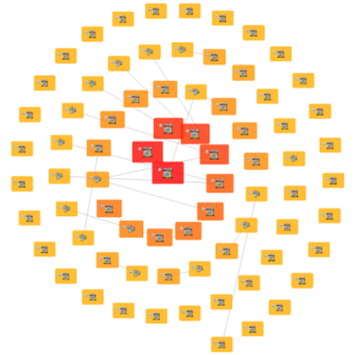
- “Compare many small cases?” Tiled
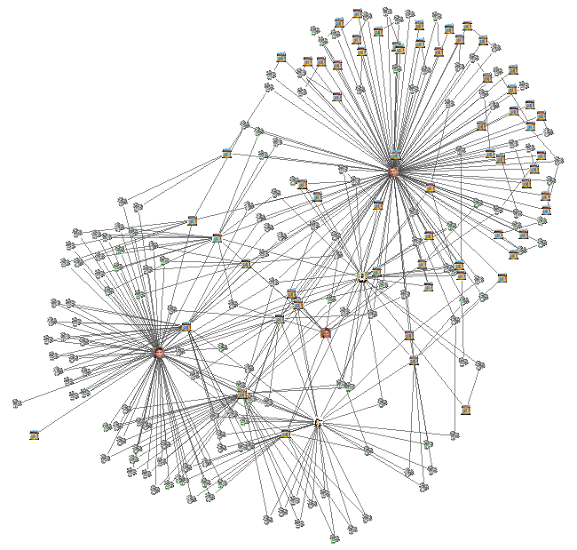
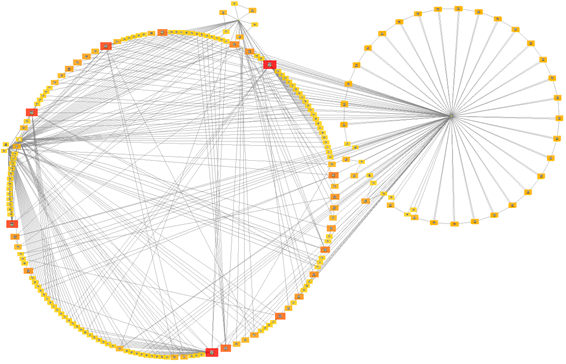
- “What ties everything together?” One network
- “Which group connects to which?” Multiple circles / Square / Rectangle / Triangular
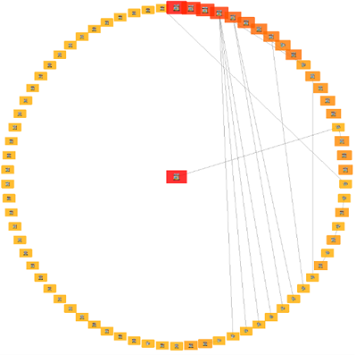
- “Show peers with equal voice?” One circle / Ellipse
- “Show clean paths/ports?” Orthogonal
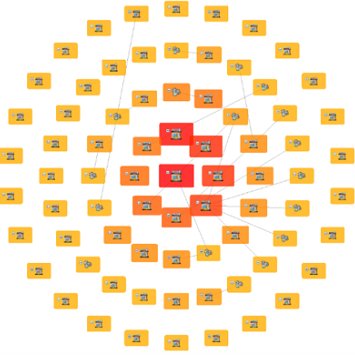
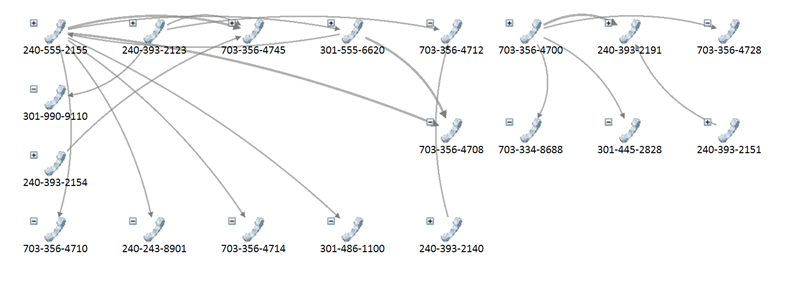
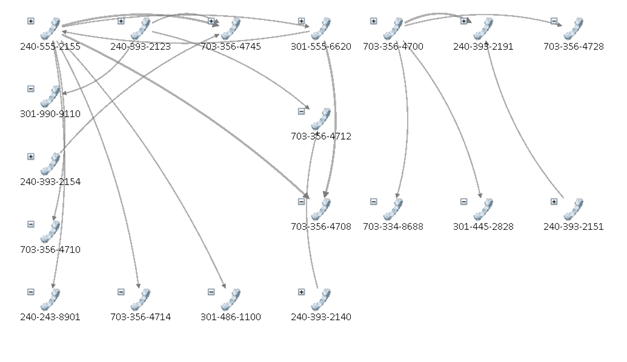
- “Where are the clusters/hubs?” Force Directed
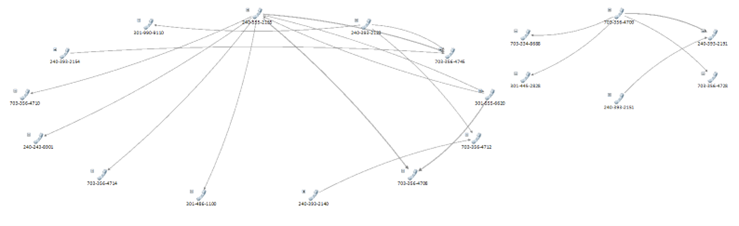
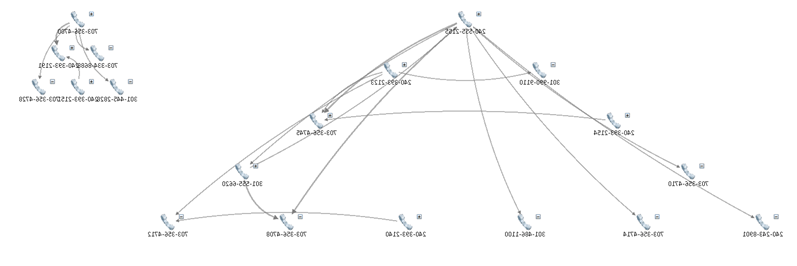
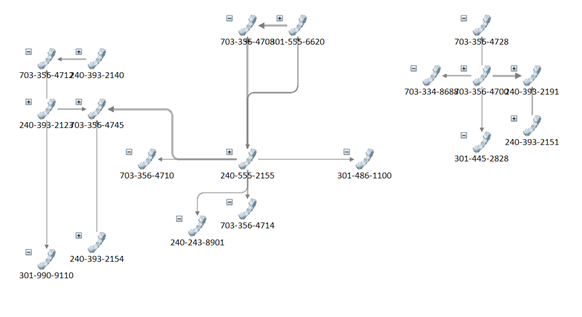
- “What’s the chain of command or dependency?” Hierarchical